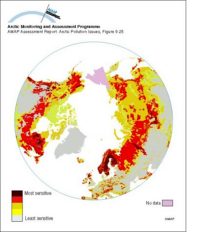
Sensitivity of Arctic ecosystems to acid deposition

Sensitivity of Arctic ecosystems to acid deposition

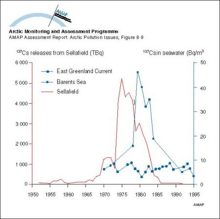
Seawater concentrations of 137Cs in the Barents and East Greenland Seas compared to the yearly releases from Sellafield

Seawater concentrations of 137Cs in the Barents and East Greenland Seas compared to the yearly releases from Sellafield

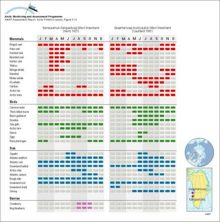
Seasonal resource utilization patterns, by month, for two communities in West Greenland

Seasonal resource utilization patterns, by month, for two communities in West Greenland

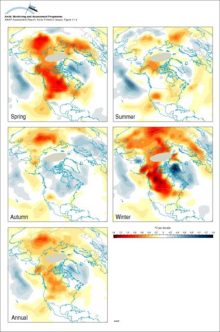
Seasonal and annual average surface temperature trends (°C per decade) over the northern hemisphere

Seasonal and annual average surface temperature trends (°C per decade) over the northern hemisphere

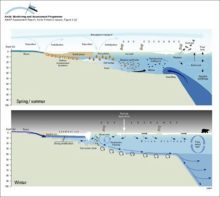
Schematic representation of shelf processes involving transport of contaminants and sea ice

Schematic representation of shelf processes involving transport of contaminants and sea ice

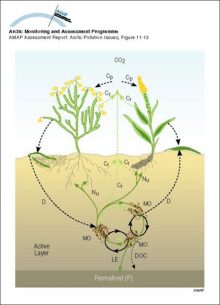
Schematic illustration of ecosystem carbon fluxes and nutrient circulation in the tundra Carbon and nutrient pathways are shown by dashed and continuous lines, respectively

Schematic illustration of ecosystem carbon fluxes and nutrient circulation in the tundra Carbon and nutrient pathways are shown by dashed and continuous lines, respectively

Schematic diagram of the Combined Model Ten climatic zones, each containing well-mixed compartments, are connected by meridional atmospheric and oceanic exchange

Schematic diagram of the Combined Model Ten climatic zones, each containing well-mixed compartments, are connected by meridional atmospheric and oceanic exchange

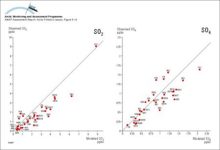
Scatterplots for comparisons between the average concentrations of SO2 and SO4 in air from October 1990 to December 1993 as monitored by the European Monitoring and Evaluation Programme (EMEP) and calculated by Christensen (1996)

Scatterplots for comparisons between the average concentrations of SO2 and SO4 in air from October 1990 to December 1993 as monitored by the European Monitoring and Evaluation Programme (EMEP) and [..]
Scatterplots for comparisons between the average concentrations of SO2 and SO4 in air from October 1990 to December 1993 as monitored by the European Monitoring and Evaluation Programme (EMEP) and calculated by Christensen (1996)

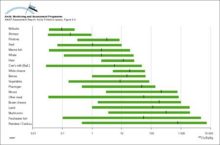
Ranges and average values of 137Cs activity concentrations in food products, from data in the AMAP radioactivity database

Ranges and average values of 137Cs activity concentrations in food products, from data in the AMAP radioactivity database

Photograph of a submarine being provided with cooling water from a supply ship

Photograph of a submarine being provided with cooling water from a supply ship

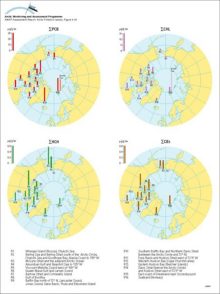
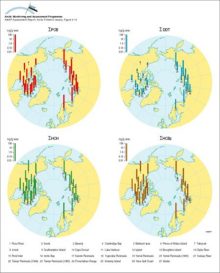
Organochlorine levels in polar bear adipose tissues (µg/g lw), adjusted to levels expected in 11-year-old males (after correction for age and sex), for sum-PCB, sum-CHL, sum-HCH, and sum-CBz, and in Arctic fox from Svalbard for sum-PCB and sum-CHL

Organochlorine levels in polar bear adipose tissues (µg/g lw), adjusted to levels expected in 11-year-old males (after correction for age and sex), for sum-PCB, sum-CHL, sum-HCH, and sum-CBz, and in [..]
Organochlorine levels in polar bear adipose tissues (µg/g lw), adjusted to levels expected in 11-year-old males (after correction for age and sex), for sum-PCB, sum-CHL, sum-HCH, and sum-CBz, and in Arctic fox from Svalbard for sum-PCB and sum-CHL

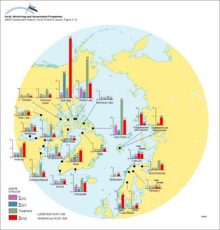
OC levels (µg/g lw in muscle) in landlocked and anadromous (italic labels) Arctic char

OC levels (µg/g lw in muscle) in landlocked and anadromous (italic labels) Arctic char

Observed and predicted organochlorine concentrations (ng/g ww) in caribou and reindeer (Rangifer tarandus) liver All data are presented in, or were derived from data in Annex Table 6A4

Observed and predicted organochlorine concentrations (ng/g ww) in caribou and reindeer (Rangifer tarandus) liver All data are presented in, or were derived from data in Annex Table 6A4

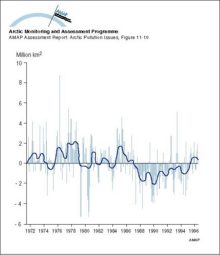
Monthly snow cover anomalies over northern hemispheric lands (including Greenland) between January 1972 and August 1995 Also shown are the 12-month running anomalies of hemispheric snow extent, plotted on the seventh month of a given interval

Monthly snow cover anomalies over northern hemispheric lands (including Greenland) between January 1972 and August 1995 Also shown are the 12-month running anomalies of hemispheric snow extent, [..]
Monthly snow cover anomalies over northern hemispheric lands (including Greenland) between January 1972 and August 1995 Also shown are the 12-month running anomalies of hemispheric snow extent, plotted on the seventh month of a given interval

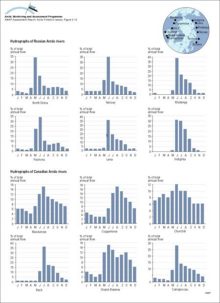
Monthly mean discharge expressed as a percent of annual discharge from available data for selected Russian and Canadian rivers draining to the Arctic

Monthly mean discharge expressed as a percent of annual discharge from available data for selected Russian and Canadian rivers draining to the Arctic


Related regions to search:
Number of graphics per country noted in paranthesis

Zoom out     Zoom in