More information and download links below the graphic.
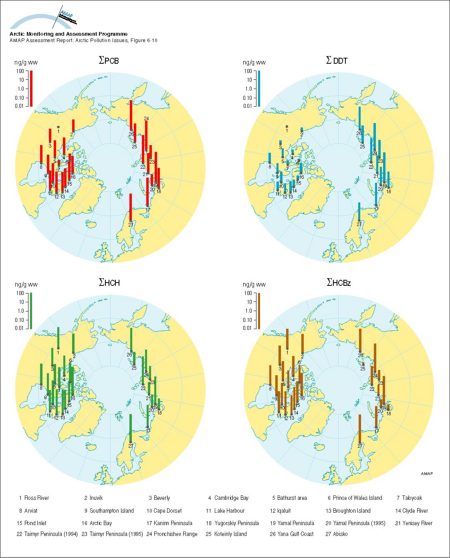
Observed and predicted organochlorine concentrations (ng/g ww) in caribou and reindeer (Rangifer tarandus) liver All data are presented in, or were derived from data in Annex Table 6A4

Click here, or on the graphic, for full resolution.
Observed and predicted organochlorine concentrations (ng/g ww) in caribou and reindeer (Rangifer tarandus) liver All data are presented in, or were derived from data in Annex Table 6A4
| Sources | Title (cont.) The liver wet weight concentrations were predicted from lipid wet weight with the linear equation: liver ww = k x lipid ww, in which the k's were derived from raw data from three Canadian Arctic locations (Elkin pers. comm.) and were as follows: 0.0675 for HCBz, 0.0792 for sum-DDT, 0.2675 for HCH, and 0.0973 for sum-PCB. (AAR Figure 6.10) | ||||
|
Cartographer/ Designer |
Graphical production: Philippe Rekacewicz and Emmanuelle Bournay (GRID-Arendal) | ||||
| Appears in |
AMAP Assessment Report: Arctic Pollution Issues |
||||
| Published | 1998 | ||||
| Feedback/Comment/Inquiry | Contact webmaster | ||||
| Search for other graphics |
With related subjects Covering the same geographic area |
||||
|
Available Downloads
(please review use constraints above) |
|
||||
|
Citation/Reference Use constraints |
Please refer to the AMAP policy regarding use and reproduction of AMAP maps and graphics |
