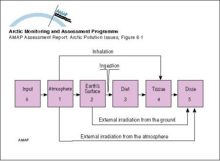
Compartment model used to assess doses from releases of radioactive materials to the atmosphere from nuclear testing

Compartment model used to assess doses from releases of radioactive materials to the atmosphere from nuclear testing

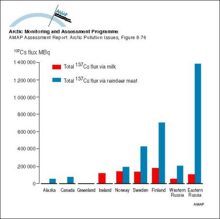
Comparison of the predicted flux of 137Cs in milk and reindeer meat in different Arctic areas, for the first year after an assumed uniform deposition of 100 kBq/m2

Comparison of the predicted flux of 137Cs in milk and reindeer meat in different Arctic areas, for the first year after an assumed uniform deposition of 100 kBq/m2

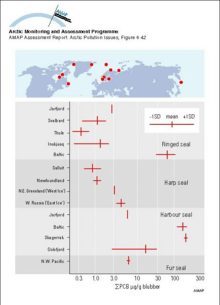
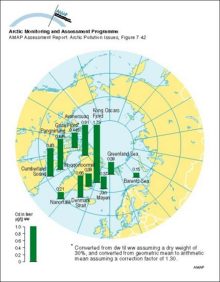
Comparison of sum-PCB concentrations in seal blubber from various Arctic regions with results from the same species in temperate waters Vertical bars represent means and the horizontal bars the standard deviation, where available

Comparison of sum-PCB concentrations in seal blubber from various Arctic regions with results from the same species in temperate waters Vertical bars represent means and the horizontal bars the [..]
Comparison of sum-PCB concentrations in seal blubber from various Arctic regions with results from the same species in temperate waters Vertical bars represent means and the horizontal bars the standard deviation, where available

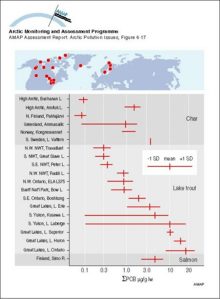
Comparison of sum-PCB concentrations (lipid normalized) in Arctic versus temperate zone salmonid fish See Annex Table 6A9 for wet weight concentrations

Comparison of sum-PCB concentrations (lipid normalized) in Arctic versus temperate zone salmonid fish See Annex Table 6A9 for wet weight concentrations

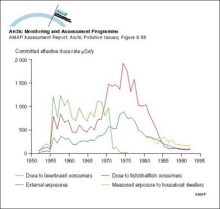
Comparison of doses to critical groups for Sellafield discharges from 1952 to 1993

Comparison of doses to critical groups for Sellafield discharges from 1952 to 1993

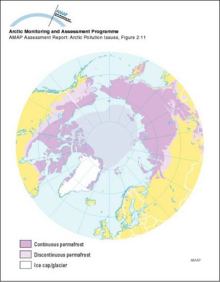
Circumpolar permafrost distribution

Circumpolar permafrost distribution

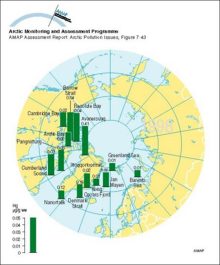
Circumpolar distribution of Hg levels in muscle tissue of Arctic cod (Boreogadus saida) Arithmetic mean concentrations

Circumpolar distribution of Hg levels in muscle tissue of Arctic cod (Boreogadus saida) Arithmetic mean concentrations

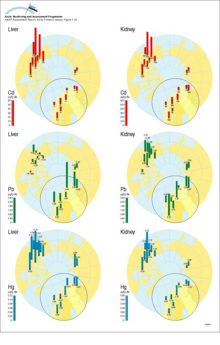
Circumpolar distribution of Cd, Pb and Hg levels in liver and kidney tissue of willow ptarmigan (Lagopus lagopus)

Circumpolar distribution of Cd, Pb and Hg levels in liver and kidney tissue of willow ptarmigan (Lagopus lagopus)

Circumpolar distribution of Cd levels in liver tissue of Arctic cod (Boreogadus saida) Arithmetic mean concentrations

Circumpolar distribution of Cd levels in liver tissue of Arctic cod (Boreogadus saida) Arithmetic mean concentrations

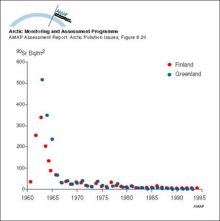
Changes with time in wet and dry deposition of 90Sr in Arctic Finland and Greenland

Changes with time in wet and dry deposition of 90Sr in Arctic Finland and Greenland

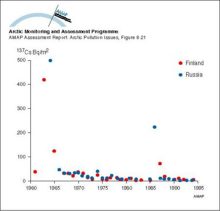
Changes with time in wet and dry deposition of 137Cs in Arctic Finland and north west Russia (Nenets Autonomous Okrug)

Changes with time in wet and dry deposition of 137Cs in Arctic Finland and north west Russia (Nenets Autonomous Okrug)

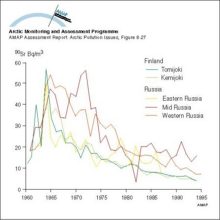
Changes with time in activity concentration of 90Sr in Russian and Finnish rivers

Changes with time in activity concentration of 90Sr in Russian and Finnish rivers

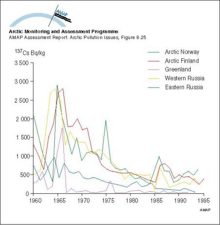
Changes with time in activity concentration of 137Cs in reindeer meat in Arctic Norway, Arctic Finland, Greenland, and Arctic Russia

Changes with time in activity concentration of 137Cs in reindeer meat in Arctic Norway, Arctic Finland, Greenland, and Arctic Russia

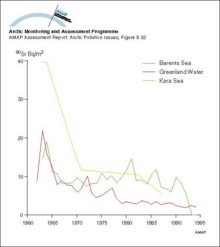
Changes with time in 90Sr activity concentrations in surface seawater from Greenland waters and the Barents and Kara Seas

Changes with time in 90Sr activity concentrations in surface seawater from Greenland waters and the Barents and Kara Seas

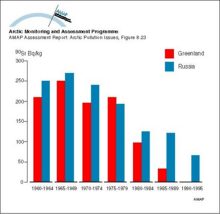
Changes with time in 90Sr activity concentration (5-year means) in lichens in Greenland and Russia

Changes with time in 90Sr activity concentration (5-year means) in lichens in Greenland and Russia


Related regions to search:
Number of graphics per country noted in paranthesis

Zoom out     Zoom in