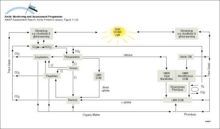
Illustration of the role of UV radiation in various light-dependent processes Natural UV radiation impacts the numbers, distribution and activity of several aquatic ecosystem targets and thus, theoretically, their interactions

Illustration of the role of UV radiation in various light-dependent processes Natural UV radiation impacts the numbers, distribution and activity of several aquatic ecosystem targets and thus, [..]
Illustration of the role of UV radiation in various light-dependent processes Natural UV radiation impacts the numbers, distribution and activity of several aquatic ecosystem targets and thus, theoretically, their interactions

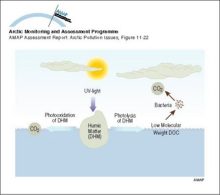
Illustration of the role of UV radiation in the biogeochemical cycling of DOC

Illustration of the role of UV radiation in the biogeochemical cycling of DOC

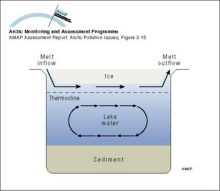
Illustration of the movement of less dense spring freshet water moving through a small Arctic lake underneath the surface ice cover, but not mixing with the water column

Illustration of the movement of less dense spring freshet water moving through a small Arctic lake underneath the surface ice cover, but not mixing with the water column

Illustration of the concept of a) the 'zone of influence' through major contaminant pathways from a major source region, and b) the 'contaminant focussing zone' resulting from the convergence of pathways carrying contaminants from a variety of sources

Illustration of the concept of a) the 'zone of influence' through major contaminant pathways from a major source region, and b) the 'contaminant focussing zone' resulting from the convergence of [..]
Illustration of the concept of a) the zone of influence through major contaminant pathways from a major source region, and b) the contaminant focussing zone resulting from the convergence of pathways carrying contaminants from a variety of sources

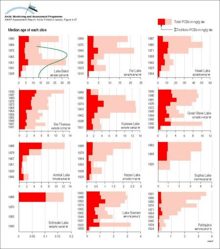
Historical profiles of PCBs (trichloro- and all other) in slices from dated sediment cores in Alaska, Canada, and Finland Median age of each slice is given on the vertical axis The green lines indicate the source function of PCBs

Historical profiles of PCBs (trichloro- and all other) in slices from dated sediment cores in Alaska, Canada, and Finland Median age of each slice is given on the vertical axis The green lines [..]
Historical profiles of PCBs (trichloro- and all other) in slices from dated sediment cores in Alaska, Canada, and Finland Median age of each slice is given on the vertical axis The green lines indicate the source function of PCBs

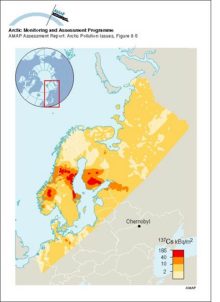
Ground deposition of 137Cs from the Chernoybl accident (values normalised to May 10, 1986)

Ground deposition of 137Cs from the Chernoybl accident (values normalised to May 10, 1986)

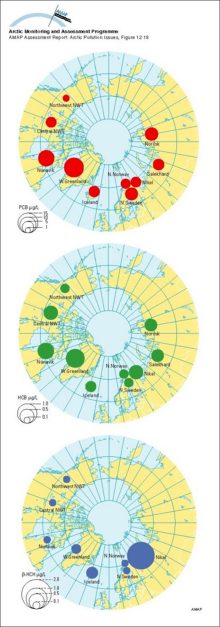
Geometric mean concentrations of PCB, HCB and B-HCH in maternal blood plasma; AMAP circumpolar study 1995, see Table 12A12

Geometric mean concentrations of PCB, HCB and B-HCH in maternal blood plasma; AMAP circumpolar study 1995, see Table 12A12

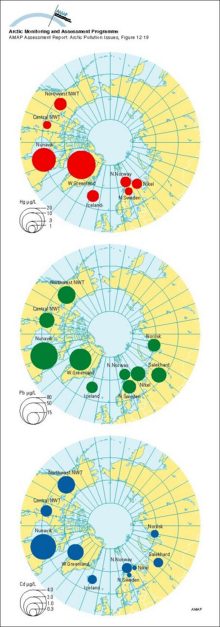
Geometric mean concentrations of mercury, lead and cadmium in maternal whole blood; AMAP circumpolar study 1994-95, see Table 12A13

Geometric mean concentrations of mercury, lead and cadmium in maternal whole blood; AMAP circumpolar study 1994-95, see Table 12A13

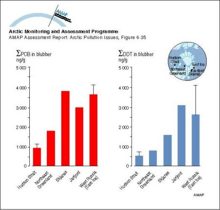
Geographical trends of PCB and DDT in harp seals from Arctic waters Vertical bars represent arithmetic means ± SD of combined results for males and females The SD has been estimated from the range in some cases

Geographical trends of PCB and DDT in harp seals from Arctic waters Vertical bars represent arithmetic means ± SD of combined results for males and females The SD has been estimated from the range in [..]
Geographical trends of PCB and DDT in harp seals from Arctic waters Vertical bars represent arithmetic means ± SD of combined results for males and females The SD has been estimated from the range in some cases

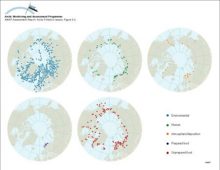
Geographical distribution of sample information in the AMAP radioactivity database

Geographical distribution of sample information in the AMAP radioactivity database

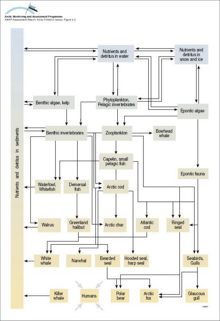
Generalized marine food web

Generalized marine food web

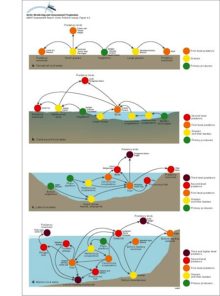
Examples of Arctic food webs, a) terrestrial, b) tundra pond, c) lake, and d) marine

Examples of Arctic food webs, a) terrestrial, b) tundra pond, c) lake, and d) marine

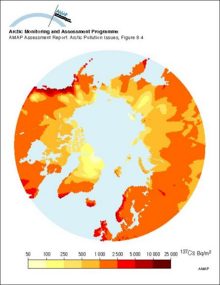
Estimated ground deposition of nuclear weapons fallout of 137Cs based on precipitation data, decay corrected to 1995

Estimated ground deposition of nuclear weapons fallout of 137Cs based on precipitation data, decay corrected to 1995

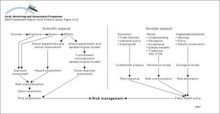
Elements involved in the evaluation and handling of risks from environmental contaminants

Elements involved in the evaluation and handling of risks from environmental contaminants

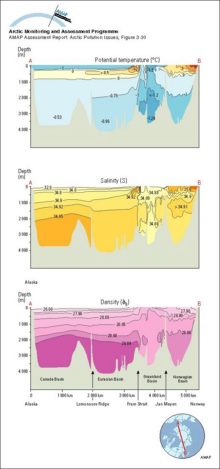
Distribution of potential temperature, salinity, and density across the Arctic Ocean and the Greenland and Norwegian Seas

Distribution of potential temperature, salinity, and density across the Arctic Ocean and the Greenland and Norwegian Seas


Related regions to search:
Number of graphics per country noted in paranthesis

Zoom out     Zoom in