More information and download links below the graphic.
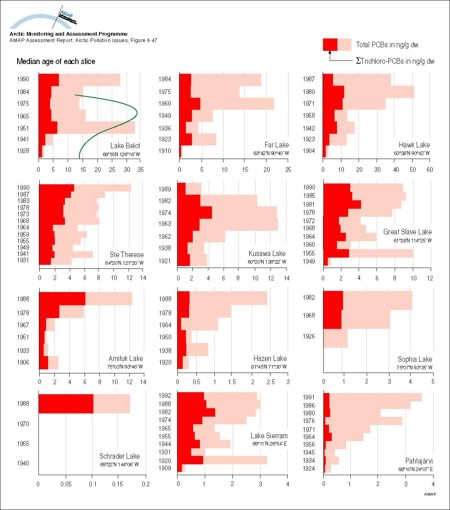
Historical profiles of PCBs (trichloro- and all other) in slices from dated sediment cores in Alaska, Canada, and Finland Median age of each slice is given on the vertical axis The green lines indicate the source function of PCBs

Click here, or on the graphic, for full resolution.
Historical profiles of PCBs (trichloro- and all other) in slices from dated sediment cores in Alaska, Canada, and Finland Median age of each slice is given on the vertical axis The green lines indicate the source function of PCBs
| Sources | Title (cont.) in the U.S. and in Europe, that is, the approximate duration and relative amount used (no units). Source function data: Rapaport, R.A. and S.J. Eisenreich, 1988. Historical atmospheric inputs of high molecular weight chlorinated hydrocarbons to Eastern North America. Environ. Sci. Technol. 22: 931 - 941. (AAR Figure 6.47) | ||||
|
Cartographer/ Designer |
Graphical production: Philippe Rekacewicz and Emmanuelle Bournay (GRID-Arendal) | ||||
| Appears in |
AMAP Assessment Report: Arctic Pollution Issues |
||||
| Published | 1998 | ||||
| Feedback/Comment/Inquiry | Contact webmaster | ||||
| Search for other graphics |
With related subjects Covering the same geographic area |
||||
|
Available Downloads
(please review use constraints above) |
|
||||
|
Citation/Reference Use constraints |
Please refer to the AMAP policy regarding use and reproduction of AMAP maps and graphics |
