5. The 2008 flood season
5.6 Aspects of probability and risk
Extreme events such as that of 2008 in the northern reaches of the Lower Mekong Basin prescribe a need to reassess the mainstream flood risk by including the event in the sample for reanalysis. Appendix A1.2 of the 2006 Annual Flood Report provided estimates of the distribution of flood risk along the mainstream at ten\ locations in terms of annual peak discharge and the total seasonal flood volume. Annual maximum water levels were considered at a further four sites in Cambodia and the Delta in Viet Nam.
For the reach of the mainstream primarily affected by the August 2008 event the annual maximum flood peak data to 2008 were statistically re-evaluated with the following results:
| Mainstream site | Recurrence
interval (years) |
|||||
2 |
5 |
10 |
20 |
50 |
100 |
|
| Chiang Saen | 10,000 |
13,000 |
14,500 |
16,000 |
18,000 |
20,000 |
| Luang Prabang | 14,500 |
17,700 |
19,800 |
21,800 |
24,400 |
26,400 |
| Chiang Khan | 15,800 |
18,600 |
20,700 |
22,800 |
25,400 |
27,300 |
| Vientiane |
16,200 |
19,200 |
21,000 |
23,000 |
25,600 |
27,800 |
| Mainstream site | Peak
discharge (cumecs) |
Recurrence
interval (years) |
| Chiang Saen | 13,300 |
1:7 |
| Luang Prabang | 23,100 |
1:30 |
| Chiang Khan | 23,200 |
1:25 |
| Vientiane |
23,500 |
1:25 |
Further downstream at Pakse and Kratie the 2008 peaks were no more than average with annual return periods of the order of 1:2 years.
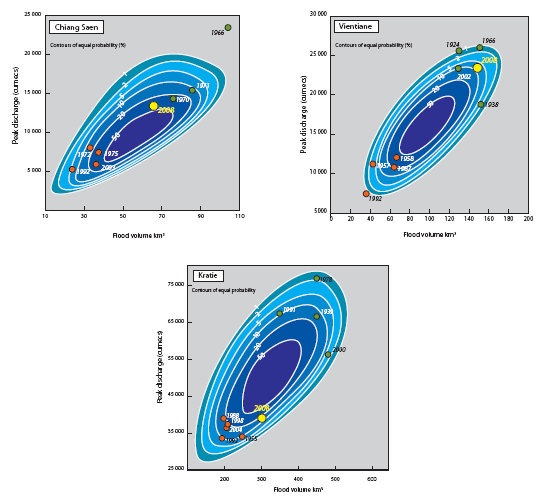
On large rivers a more complete statistical assessment of flood risk is obtained if the peak and volume of the event are considered jointly within a probabilistic context. This recognises the fact that the duration of flows above critical thresholds and therefore the potential period of inundation is often as important as the peak discharge, which is related to the maximum depth of flooding. Adamson et al. (1999) developed a method for obtaining a bivariate extreme value model of flood peak and volume which provides the type of result indicated in Figure 5.11. This may be perceived as adding the dimension of probability to the simple scatter plots shown in Figure 5.10.
Figure 5.1: Bivariate
probabilities of the joint distribution of flood peak and
volume at selected mainstream sites. For example, points lying
outside of the 1% isoline would have a recurrence interval
in excess of 1:100 years, any outside of the 2% contour a
recurrence interval in excess of 1:50 years, and so on.
- At Chiang Saen the 2008 flood has a bivariate probability of occurrence of less than 20% or 1:5 years and was therefore unremarkable in both respects. The magnitude of the outlier that is the 1966 flood is clear in terms of both peak and volume.
- At Vientiane the 2008 flood hydrograph an annual probability of occurrence in biforate terms of between 10 and 5% or 1:10 to 1:20 years.
- At Kratie the 2008 hydrograph was below average in terms of both variables to an extent that would be expected with an annual probability of 20% or once on the average every 5 years.
Choose a newsletter:
