5. The 2008 flood season
5.7 Conditions on the Cambodian floodplain and in the Delta
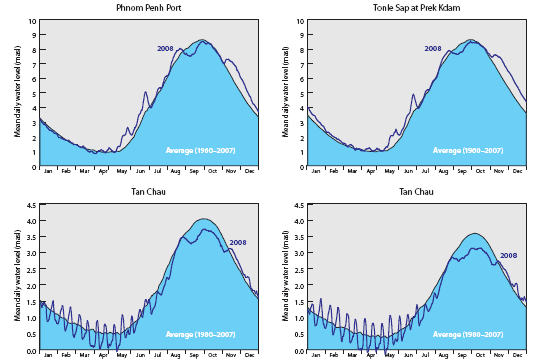
Consistent with the systematic diminishing of the magnitude 2008 flood downstream of Vientiane, daily water levels in Cambodia and the Delta were unexceptional during the season as can be seen from Figure 5.12.
Figure 5.12: Mean daily
water levels in Cambodia and the Mekong Delta for 2008 compared
to their long term daily average.
In 2008 the start and end of the flood season, defined as the period of the year when water levels exceed their long term average, were typical, except at Prek Kdam where the season did not end until the first week of 2009:
| Site | Onset of flood season | End of flood season | ||||
| Historical average | Standard Deviation | 2008 | Historical average | Standard Deviation | 2008 | |
| Phnom Penh | 10th July | 14 days | 9th July | 14th Nov | 14 days | 15th Dec |
| Prek Kdam |
11th July |
16 days |
8th July | 20th Dec |
17 days |
3rd Jan |
| Tan Chau |
19th July |
20 days |
18th July | 17th Dec |
12 days | 16th Dec |
| Chau Doc |
23rd July |
17 days |
22nd July |
19th Dec |
12 days |
19th Dec |
Meanwhile, the maximum water levels achieved in 2008 fell well below the annual average figures:
| Site | Period of Record | Annual
maximum water level. (masl) |
||
Historical
average |
Standard
Deviation |
2008 |
||
| Phnom Penh Port |
1960 – 2008 |
9.02 |
0.67 |
8.49 |
| Prek Kdam | 1960 – 2008 | 9.08 |
0.73 |
8.63 |
| Tan Chau | 1980 – 2008 | 4.30 |
0.54 |
3.73 |
| Chao Doc | 1980 – 2008 | 3.82 |
0.58 |
3.14 |
Choose a newsletter:
