5. The 2008 flood season
5.5 Flood discharges and flood volumes
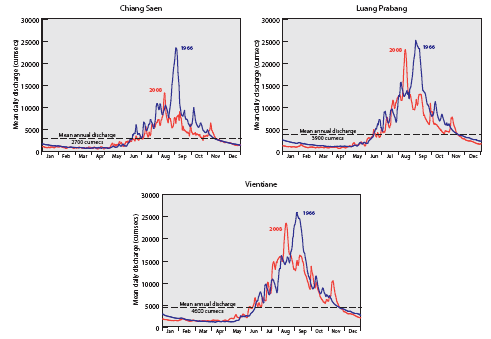
Following up the similarity between the floods of 1966 and 2008, Figure 5.8 shows the comparative discharge hydrographs for the two years at Chiang Saen, Luang Prabang and Vientiane:
Figure 5.8: Mekong
at Chiang Saen, Luang Prabang and Vientiane – comparative
1966 and 2008 daily discharge hydrographs.
- At Chiang Saen the 2008 event does not compare with that of 1966 either in terms of peak discharge or flood volume, underscoring the fact that in 2008 outflows from China were not a major contributory factor, but were in 1966. Never the less the maximum discharge reached on the 12th of August 2008 of 13,300 cumecs has only been exceeded three times in 1966, 1970 and 1971 since records began in 1960. As will be seen, the peak discharge of 23,500 cumecs in 1966 was a huge outlier in the time series of annual maxima at Chiang Saen.
- At Luang Prabang and Vientiane on the other hand the two events are similar both in terms of peak and volume.
At Chiang Saen and Luang Prabang the relationship between peak water level and discharge is consistent, both were higher in 1966. Conversely, at Vientiane although the water level reached in 2008 was 1 m higher than that of 1966, the discharge was slightly less. In 1966 peak flood discharge was 26,000 cumecs, while that in 2008 was 23,500 cumecs. The explanation lies with the flood protection works that were undertaken after 1966 on both the Thai and Lao banks of the river, subsequent to the inundation of Vientiane, Si Chiang Mai and Nong Khai. These works involved raising flood protection levees that contain the river within its channel up to 14 m above the gauge datum or 172 masl. This explains why for a given discharge water levels are now higher and why the river did not overtop its banks and inundate central Vientiane as it did in 1966.
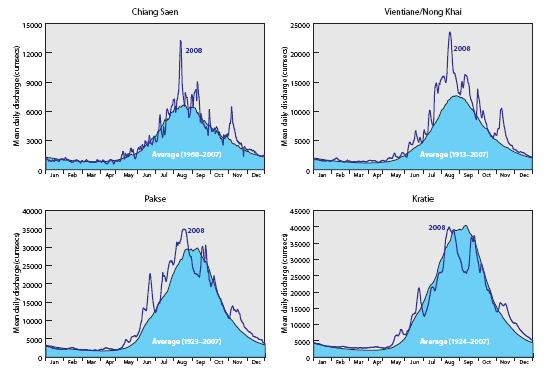
Further downstream the severity of the flood conditions of August 2008 dissipated since the mainstream tributary inflows downstream of Vientiane were average or below. Figure 5.9 indicated that at Chiang Saen the peak discharge in August is more than twice the average discharge for the month but with the exception of further higher periods of flow in September and November daily flows over the rest of the year were close to average. At Vientiane discharges were way above normal throughout the major part of the flood season but by the time the river reached Kratie the annual flood hydrograph as a whole for 2008 was unexceptional, with below normal flood volumes.
Figure 5.9: The 2008
daily discharge hydrograph at selected sites on the Mekong
mainstream, compared to the long term average.
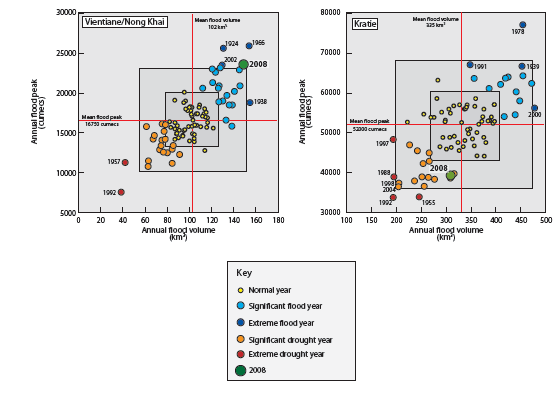
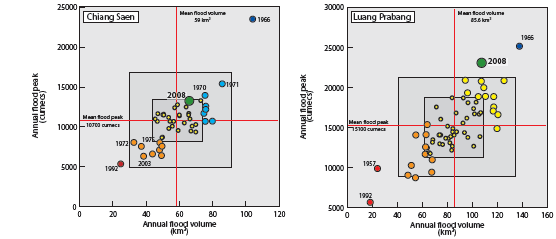
These observations are summarised in Figure 5.10 that shows the historical joint sample distribution of annual flood peak and volume.

Figure 5.10: Scatter plots of the joint distribution
of the annual maximum flood discharge (cumecs) and the volume
of the annual flood hydrograph (km3) at selected sites on
the Mekong mainstream. The ‘boxes’ indicate one ( 1ä ) and
two ( 2ä ) standard deviations for each variable above and
below their respective means. Events outside of the 1ä box
might be defined as ‘significant’ flood years and those outside
of the 2ä box as historically ‘extreme’ flood years.
- According to the criteria, 2008 at Chiang Sean would be defined as a significant flood year in terms of peak discharge but ‘normal’ with respect to flood volume. The fact that 1966 is a complete outlier in both respects is clear.
- At Luang Prabang and Vientiane the 2008 event was extreme in terms of both variables and exceeded only in 1924 and 1966.
- Much further downstream at Kratie the 2008 event was significantly below normal in terms of peak discharge. The annual flood volume was, however, only marginally less than average.
Choose a newsletter:


