Illegal discharges of oil in the Baltic Sea during 2008
|
|||
Key message
![]() A decreasing trend in the number of observed illegal oil discharges despite rapidly growing density of shipping, increased frequency of the surveillance flights and improved usage of remote sensing equipment is illustrating the positive results of the complex set of measures known as the Baltic Strategy, implemented by the Contracting Parties to the Helsinki Convention.
A decreasing trend in the number of observed illegal oil discharges despite rapidly growing density of shipping, increased frequency of the surveillance flights and improved usage of remote sensing equipment is illustrating the positive results of the complex set of measures known as the Baltic Strategy, implemented by the Contracting Parties to the Helsinki Convention.
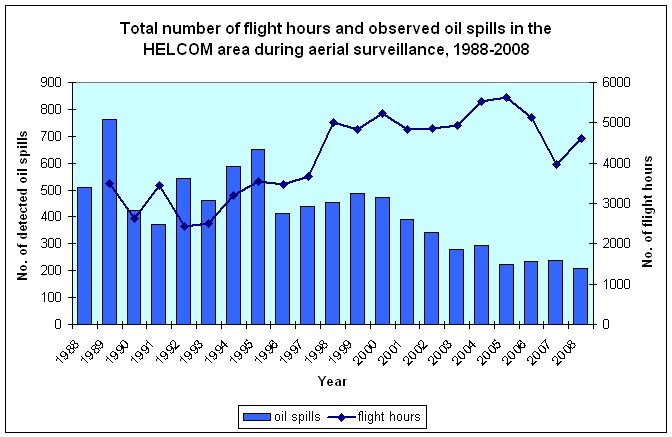
![]() Altogether 210 oil spills were observed in 2008, which is 28 less than in 2007.
Altogether 210 oil spills were observed in 2008, which is 28 less than in 2007.

Figure 1. The total number of flight hours and observed oil spills in the HELCOM area during aerial surveillance, 1988-2008.
Results and Assessment
Environmental context
Oil is a major threat to Baltic Sea ecosystems. In the last decade maritime transportation has been growing steadily, reflecting the intensified co-operation and trade in the Baltic Sea region and a prospering economy.
An increase in the number of ships also means that one could expect a larger number of illegal oil discharges. Both oil tankers and other kinds of ships are among the suspected offenders of anti-pollution regulations.
Policy context
Any discharge into the Baltic Sea of oil, or diluted mixtures containing oil in any form including crude oil, fuel oil, oil sludge, or refined products, is prohibited. This applies to oily water from the machinery spaces of any ship, as well as from ballast or cargo tanks from oil tankers.
The prohibition stems from the international designation of the Baltic Sea area as a “special area” under the International Convention for the Prevention of Pollution from Ships (MARPOL 73/78).
To uphold the prohibition, the 1992 Helsinki Convention requires all ships, with some exceptions, to deliver the oil to a reception facility before leaving the port. To further encourage the delivery the countries bordering on the Baltic Sea have agreed that a ship should not be charged for using the reception facilities (also known as the no-special-fee system). The costs have to be covered e.g. by general harbor fees or general environmental fees.
The Convention on the Protection of the Marine Environment of the Baltic Sea Area, 1992 (the 1992 Helsinki Convention) spells out a duty for the States bordering on the Baltic Sea to conduct aerial surveillance for detecting suspected offenders of anti-pollution regulations at sea. All coastal states should endeavor to fly - as a minimum - twice per week over regular traffic zones including approaches to major sea ports as well as in regions with regular offshore activities. Other regions with sporadic traffic and fishing activities should be covered once per week. Experienced observers/pilots shall hereby conduct reliable detections, classifications and quantification of observed pollution, their frequencies and geographical distributions.
Also the Coordinated Extended Pollution Control Flights (CEPCO), which constitute continuous surveillance of specific areas in the Baltic Sea for 24 or more hours, should be carried out twice a year.
Directive 2000/59/EC of 27 November 2000 has as its aim to reduce the discharges of ship-generated wastes and cargo residues into the sea, especially illegal discharges, by improving the availability and use of port reception facilities. The Directive recognizes and does not contradict with the procedures and mechanisms agreed by the Contracting Parties to the Helsinki Convention.Assessment
Deliberate illegal oil discharges from ships are regularly observed within the Baltic Sea since 1988. As from 1999 the number of observed illegal oil discharges is gradually decreasing (from 488 in 1999 to 210 in 2008). A significant decrease in the number of deliberate oil spills (28) was reported in 2008 compared to 2007 which is a positive sign, especially considering the increased shipping traffic as well as enhanced use of satellite imageries complementing aerial surveillance activities.
Decrease in the number of observed illegal discharges despite rapidly growing density of shipping, increased frequency of the surveillance flights and improved usage of remote sensing equipment is illustrating the positive results of the complex set of measures known as a Baltic Strategy implemented by the Contracting Parties to the Helsinki Convention.
Also increased amount of waste delivered to the Baltic Sea ports illustrate that more and more ships rather deliver oil waste to ports than illegally discharge into the Baltic Sea.
Although the number of observations of illegal oil discharges shows a decreasing trend over the years it should be kept in mind that for some areas aerial surveillance is not evenly and regularly carried out and therefore there are no reliable figures for these areas.
To see maps illustrating illegal discharges, click on the years below:
References
The data has been collected by Response group - HELCOM RESPONSE
Supporting information
http://www.helcom.fi/shipping/waste/en_GB/surveilance/
Data
Table 1. Compiled data on performed flight hours by country in 1989-2008
| Denmark | Estonia | Finland | Germany | Lithuania | Latvia | Poland | Russia | Sweden | Total | |
| 1989 | 142 | 131 | 1618 | 1600 | 3491 | |||||
| 1990 | 292 | 168 | 400 | 164 | 1600 | 2624 | ||||
| 1991 | 199 | 129 | 348 | 408 | 140 | 629 | 1600 | 3453 | ||
| 1992 | 172 | 267 | 78 | 127 | 62 | 32 | 1700 | 2438 | ||
| 1993 | 153 | 40 | 201 | 133 | 24 | 49 | 1900 | 2500 | ||
| 1994 | 253 | 420 | 290 | 18 | 179 | 2038 | 3198 | |||
| 1995 | 225 | 420 | 355 | 291 | 8 | 301 | 1953 | 3553 | ||
| 1996 | 275 | 305 | 400 | 313 | 65 | 8 | 345 | 1763 | 3474 | |
| 1997 | 209 | 284 | 355 | 288 | 64 | 291 | 2189 | 3680 | ||
| 1998 | 325 | 236 | 649 | 206 | 577 | 465 | 2544 | 5002 | ||
| 1999 | 416 | 268 | 603 | 286 | 320 | 375 | 2565 | 4833 | ||
| 2000 | 497 | 212 | 660 | 439 | 250 | 436 | 362 | 2374 | 5230 | |
| 2001 | 463 | 161 | 567 | 466 | 300 | 412 | 187 | 2281 | 4837 | |
| 2002 | 412 | 153 | 605 | 469 | 387 | 320 | 2518 | 4864 | ||
| 2003 | 510 | 201 | 615 | 446 | 414 | 228 | 2532 | 4946 | ||
| 2004 | 265 | 198 | 644 | 491 | 100 | 365 | 239 | 3231 | 5534 | |
| 2005 | 251 | 178 | 625 | 549 | 54 | 384 | 141 | 3455 | 5638 | |
| 2006 | 290 | 471 | 517 | 504 | 64 | 311 | 131 | 2842 | 5128 | |
| 2007 | 271 | 410 | 529 | 598 | 41 | 343 | 380 | 1397 | 3969 | |
| 2008 | 246 | 503 | 438 | 650 | 298 | 406 | 2063 | 4603 |
Table 2. Compiled data on observed illegal oil discharges by country in 1988-2008
| Denmark | Estonia | Finland | Germany | Lithuania | Latvia | Poland | Russia | Sweden | Total | |
| 1988 | 129 | 90 | 40 | 82 | 168 | 509 | ||||
| 1989 | 159 | 139 | 69 | 184 | 212 | 763 | ||||
| 1990 | 34 | 45 | 73 | 88 | 184 | 424 | ||||
| 1991 | 46 | 85 | 8 | 20 | 14 | 3 | 197 | 373 | ||
| 1992 | 18 | 18 | 76 | 34 | 15 | 92 | 13 | 278 | 544 | |
| 1993 | 17 | 7 | 43 | 28 | 6 | 110 | 250 | 461 | ||
| 1994 | 30 | 4 | 75 | 104 | 375 | 588 | ||||
| 1995 | 48 | 3 | 26 | 55 | 72 | 445 | 649 | |||
| 1996 | 36 | 42 | 44 | 50 | 241 | 413 | ||||
| 1997 | 38 | 3 | 104 | 34 | 25 | 234 | 438 | |||
| 1998 | 53 | 10 | 53 | 23 | 33 | 33 | 249 | 454 | ||
| 1999 | 87 | 33 | 63 | 72 | 18 | 18 | 197 | 488 | ||
| 2000 | 68 | 38 | 89 | 51 | 17 | 51 | 158 | 472 | ||
| 2001 | 93 | 11 | 107 | 51 | 0 | 6 | 24 | 98 | 390 | |
| 2002 | 54 | 8 | 75 | 44 | 21 | 25 | 117 | 344 | ||
| 2003 | 37 | 4 | 40 | 60 | 14 | 39 | 84 | 278 | ||
| 2004 | 30 | 19 | 36 | 42 | 0 | 13 | 10 | 143 | 293 | |
| 2005 | 28 | 24 | 32 | 34 | 0 | 5 | 5 | 2 | 94 | 224 |
| 2006 | 41 | 31 | 29 | 22 | 0 | 0 | 3 | 110 | 236 | |
| 2007 | 43 | 58 | 29 | 30 | 2 | 15 | 61 | 238 | ||
| 2008 | 41 | 46 | 28 | 24 | 5 | 22 | 44 | 210 |
Metadata
The data is gathered on the basis of national reports from the nine countries bordering on the Baltic Sea area and Contracting States to the 1992 Helsinki Convention.
For reference purposes, please cite this indicator fact sheet as follows:
[Author’s name(s)], [Year]. [Indicator Fact Sheet title]. HELCOM Indicator Fact Sheets 2009. Online. [Date Viewed], http://www.helcom.fi/environment2/ifs/en_GB/cover/.
Last updated: 22 September 2009

