More information and download links below the graphic.
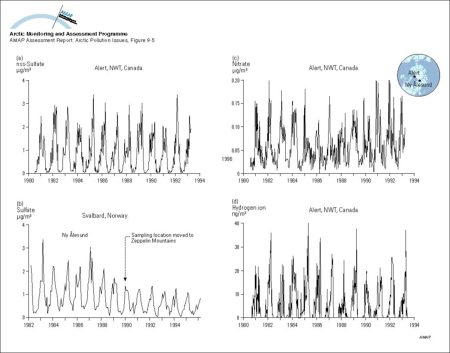
The time series of (a) weekly-averaged non-seasalt (nss) sulfate aerosol at Alert, NWT, Canada, (b) monthly-averaged sulfate aerosol at Ny Ålesund, Norway, (c) weekly-averaged nitrate at Alert, and (d) weekly-averaged hydrogen ion at Alert

Click here, or on the graphic, for full resolution.
The time series of (a) weekly-averaged non-seasalt (nss) sulfate aerosol at Alert, NWT, Canada, (b) monthly-averaged sulfate aerosol at Ny Ålesund, Norway, (c) weekly-averaged nitrate at Alert, and (d) weekly-averaged hydrogen ion at Alert
| Sources | (a, c, d) L. Barrie pers. comm., (b) data source: NILU (AAR Figure 9.5) | ||||
|
Cartographer/ Designer |
Graphical production: Philippe Rekacewicz and Emmanuelle Bournay (GRID-Arendal) | ||||
| Appears in |
AMAP Assessment Report: Arctic Pollution Issues |
||||
| Published | 1998 | ||||
| Feedback/Comment/Inquiry | Contact webmaster | ||||
| Search for other graphics |
With related subjects Covering the same geographic area |
||||
|
Available Downloads
(please review use constraints above) |
|
||||
|
Citation/Reference Use constraints |
Please refer to the AMAP policy regarding use and reproduction of AMAP maps and graphics |
