More information and download links below the graphic.
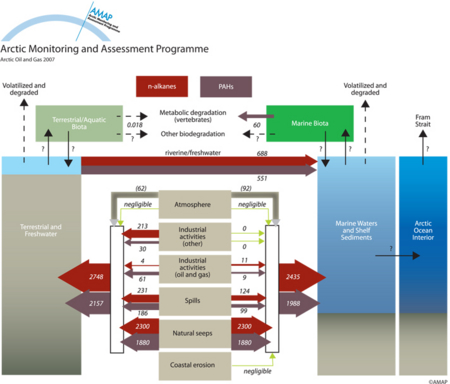
Schematic diagram of the petroleum hydrocarbon budget of the Arctic

Click here, or on the graphic, for full resolution.
Schematic diagram of the petroleum hydrocarbon budget of the Arctic; inputs via the atmosphere are primarily non-petrogenic. Units: tonnes per year
| Sources | AMAP | ||||||
|
Cartographer/ Designer |
John Bellamy | ||||||
| Appears in |
Arctic Oil and Gas 2007 |
||||||
| Published | 2010 | ||||||
| Feedback/Comment/Inquiry | Contact webmaster | ||||||
| Search for other graphics |
With related subjects Covering the same geographic area |
||||||
|
Available Downloads
(please review use constraints above) |
|
||||||
|
Citation/Reference Use constraints |
Please refer to the AMAP policy regarding use and reproduction of AMAP maps and graphics |
