More information and download links below the graphic.
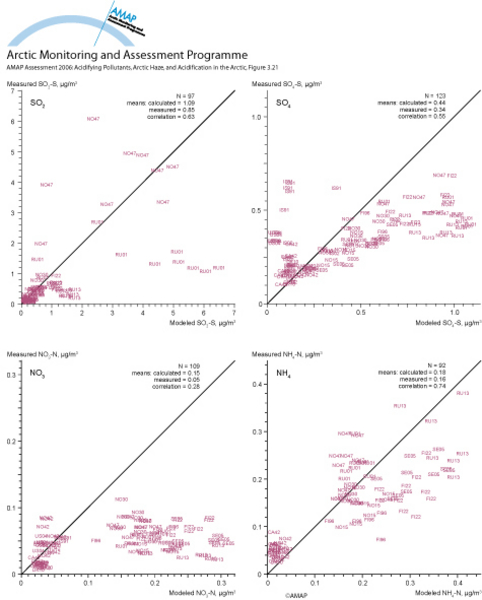
Scatterplots comparing measured and modeled annual average concentrations of sulfur dioxide, sulfate, nitrate and ammonium

Click here, or on the graphic, for full resolution.
Scatterplots comparing measured and modeled annual average concentrations of sulfur dioxide, sulfate, nitrate and ammonium at arctic monitoring stations for 1991 to 2000. Labels on graphs refer to EMEP station codes
| Sources | AMAP | ||||||
|
Cartographer/ Designer |
Satu Turtiainen, Erika Varkonyi, Petri Porvari, Marjut Nyman (Finnish Environmental Institute) | ||||||
| Appears in |
AMAP Assessment 2006: Acidifying Pollutants, Arctic Haze and Acidification in the Arctic |
||||||
| Published | 2009 | ||||||
| Feedback/Comment/Inquiry | Contact webmaster | ||||||
| Search for other graphics |
With related subjects Covering the same geographic area |
||||||
|
Available Downloads
(please review use constraints above) |
|
||||||
|
Citation/Reference Use constraints |
Please refer to the AMAP policy regarding use and reproduction of AMAP maps and graphics |
