More information and download links below the graphic.
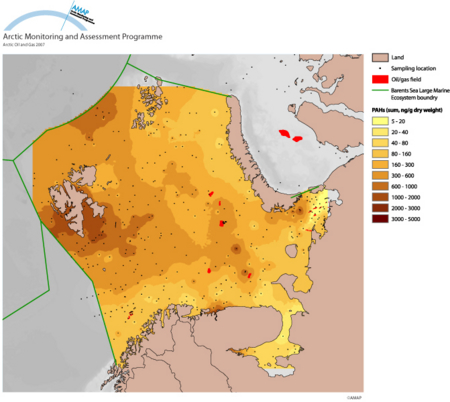
PAH concentration in bottom sediments of the Barents Sea

Click here, or on the graphic, for full resolution.
PAH concentration (ng/g dry weight) in bottom sediments of the Barents Sea. Fine structure and hot spots shown on interpolated maps, such as this, should be viewed with caution, however the general trends, such as the high concentrations around Svalbard are clear. Individual data are shown in map on next page. Grey shades indicate water depth
| Sources | AMAP | ||||||
|
Cartographer/ Designer |
John Bellamy | ||||||
| Appears in |
Arctic Oil and Gas 2007 |
||||||
| Published | 2010 | ||||||
| Feedback/Comment/Inquiry | Contact webmaster | ||||||
| Search for other graphics |
With related subjects Covering the same geographic area |
||||||
|
Available Downloads
(please review use constraints above) |
|
||||||
|
Citation/Reference Use constraints |
Please refer to the AMAP policy regarding use and reproduction of AMAP maps and graphics |
