More information and download links below the graphic.
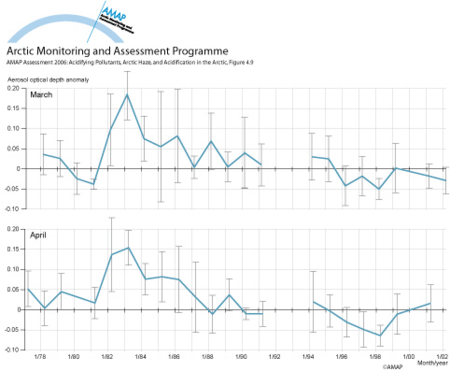
Monthly averaged aerosol optical depth anomalies at Barrow for March and April

Click here, or on the graphic, for full resolution.
Monthly averaged aerosol optical depth anomalies at Barrow (Alaska) for March and April. The anomalies are relative to a base of non-volcanic years. Data from 1992 and 1993 were removed due to stratospheric aerosol influx from the Pinatubo eruption in 1991. Vertical lines represent 1 standard deviation of the monthly mean
| Sources | data provided by NOAA CMDL | ||||||
|
Cartographer/ Designer |
Satu Turtiainen, Erika Varkonyi, Petri Porvari, Marjut Nyman (Finnish Environmental Institute) | ||||||
| Appears in |
AMAP Assessment 2006: Acidifying Pollutants, Arctic Haze and Acidification in the Arctic |
||||||
| Published | 2009 | ||||||
| Feedback/Comment/Inquiry | Contact webmaster | ||||||
| Search for other graphics |
With related subjects Covering the same geographic area |
||||||
|
Available Downloads
(please review use constraints above) |
|
||||||
|
Citation/Reference Use constraints |
Please refer to the AMAP policy regarding use and reproduction of AMAP maps and graphics |
