More information and download links below the graphic.
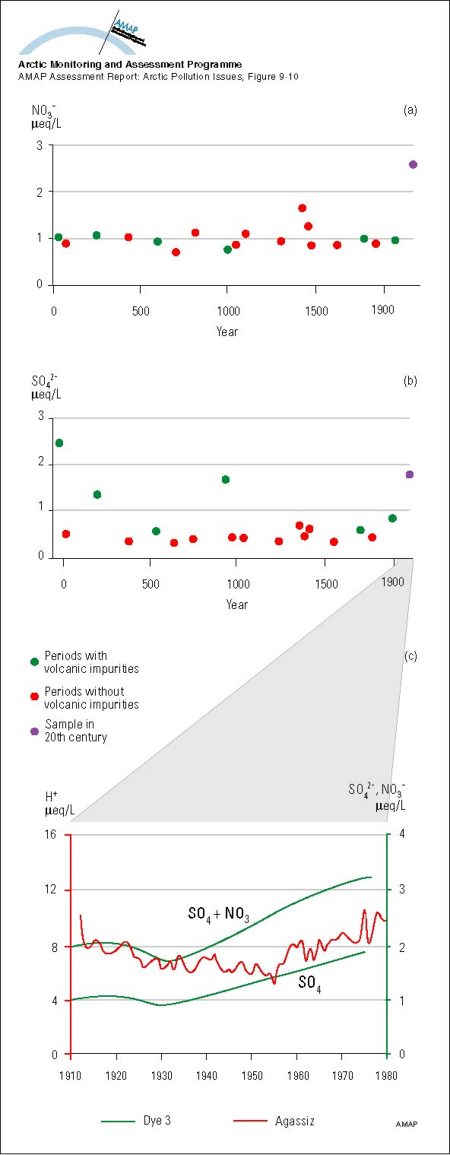
Historical records of a) NO3- and b) SO42- concentrations from the Greenland icecap at Dye 3 c) A comparison of trends in the average SO42- and SO42- plus NO3- concentrations at Dye 3 in Greenland and in the annual mean H+ concentration from Agassiz ice

Click here, or on the graphic, for full resolution.
Historical records of a) NO3- and b) SO42- concentrations from the Greenland icecap at Dye 3 c) A comparison of trends in the average SO42- and SO42- plus NO3- concentrations at Dye 3 in Greenland and in the annual mean H+ concentration from Agassiz ice
| Sources | (a, b) data source: Herron 1982; modified from Barrie 1986. Each point is a multi-year average over a period of 2-37 years. The same sample in this century is emphasized with a cross. (c) data source: Neftel et al. 1985 Agassiz icecap, Canada (inferred from conductivity by Barrie et al. 1985). The Neftel curves represent cubic spline fits reported by the authors (modified from Barrie et al. 1985). Herron, M.M., 1982. Impurity sources of F-, Cl-, NO3- and SO42- in Greenland and Antarctic precipitation. J. geophys. Res. 87: 3052-3060. Barrie, L.A., 1986. Arctic air pollution: An overview of current knowledge. Atmos. Environ. 20: 643-663. Barrie, L.A., D. Fisher and R.M. Koerner, 1985. Twentieth century trends in Arctic air pollution revealed by conductivity and acidity observations in snow and ice in the Canadian high Arctic. Atmos. Environ. 19(12): 2055-2063. (AAR Figure 9.10) | ||||
|
Cartographer/ Designer |
Graphical production: Philippe Rekacewicz and Emmanuelle Bournay (GRID-Arendal) | ||||
| Appears in |
AMAP Assessment Report: Arctic Pollution Issues |
||||
| Published | 1998 | ||||
| Feedback/Comment/Inquiry | Contact webmaster | ||||
| Search for other graphics |
With related subjects Covering the same geographic area |
||||
|
Available Downloads
(please review use constraints above) |
|
||||
|
Citation/Reference Use constraints |
Please refer to the AMAP policy regarding use and reproduction of AMAP maps and graphics |
