More information and download links below the graphic.
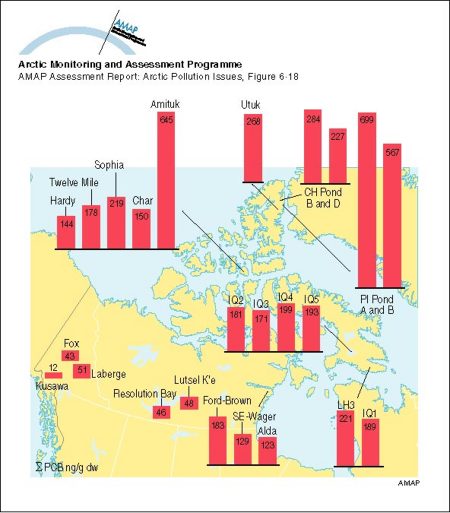
Geographic trends of sum-PCBs in zooplankton (>100 µm) in northern Canadian lakes All concentrations in ng/g dw

Click here, or on the graphic, for full resolution.
Geographic trends of sum-PCBs in zooplankton (>100 µm) in northern Canadian lakes All concentrations in ng/g dw
| Sources | Data from: Evans, M., 1994. Biomagnification of persistent organic pollutants in Great Slave Lake. In: J.L. Murray and R.G. Shearer (eds). Synopsis of research conducted under the 1993/94 Northern Contaminants Program, pp. 295-300. Indian and Northern Affairs Canada, Ottawa, Environmental Studies 72, 459p. Kidd, K.A., D.W. Schindler, R.H. Hesslein and D.C.G. Muir, 1995a. Correlation between stable nitrogen isotope ratios and concentrations of organochlorines in biota from a freshwater food web. Sci. Total Environ. 160/161: 381-390. Kidd, K.A., D.W. Schindler, D.C.G. Muir, W.L. Lockhart and R.H. Hesslein , 1995b. High concentration of toxaphene in fishes from a subartic lake. Science 269: 240-242. Koenig, B., 1996. Unpublished data on PCBs and organochlorine pesticides in zooplankton. Trent University, Peterborough, Ontario. (AAR Figure 6.18) | ||||
|
Cartographer/ Designer |
Graphical production: Philippe Rekacewicz and Emmanuelle Bournay (GRID-Arendal) | ||||
| Appears in |
AMAP Assessment Report: Arctic Pollution Issues |
||||
| Published | 1998 | ||||
| Feedback/Comment/Inquiry | Contact webmaster | ||||
| Search for other graphics |
With related subjects Covering the same geographic area |
||||
|
Available Downloads
(please review use constraints above) |
|
||||
|
Citation/Reference Use constraints |
Please refer to the AMAP policy regarding use and reproduction of AMAP maps and graphics |
