More information and download links below the graphic.
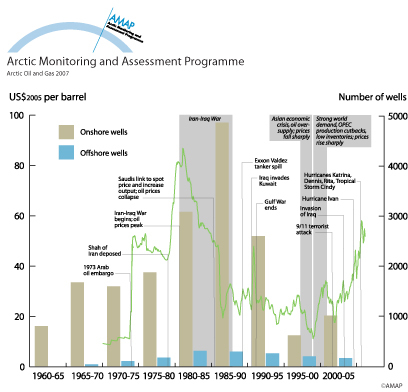
Fluctuations in the price of oil

Fluctuations in the price of oil (adjusted to 2005 dollar equivalents), showing response to World events, and numbers of exploration wells drilled onshore and offshore in different 5-year intervals.
| Sources | AMAP | ||||
|
Cartographer/ Designer |
John Bellamy | ||||
| Appears in |
Arctic Oil and Gas 2007 |
||||
| Published | 2010 | ||||
| Feedback/Comment/Inquiry | Contact webmaster | ||||
| Search for other graphics |
With related subjects Covering the same geographic area |
||||
|
Available Downloads
(please review use constraints above) |
|
||||
|
Citation/Reference Use constraints |
Please refer to the AMAP policy regarding use and reproduction of AMAP maps and graphics |
