More information and download links below the graphic.
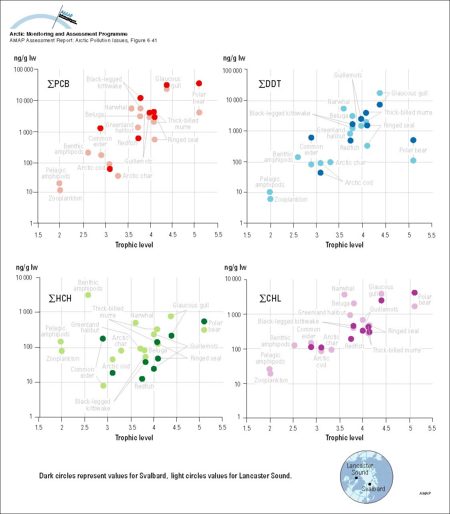
Correlations between concentrations (lw) of major persistent OCs and trophic level in the marine food web for Svalbard and Lancaster Sound Trophic level data were assigned based on Hobson and Welch (1992)

Click here, or on the graphic, for full resolution.
Correlations between concentrations (lw) of major persistent OCs and trophic level in the marine food web for Svalbard and Lancaster Sound Trophic level data were assigned based on Hobson and Welch (1992)
| Sources | Title (cont.) Trophic level of Greenland halibut and redfish were assumed to be 3.5, that is, higher than cod, but lower than seals. Data for invertebrates are from Hargrave (1994). Other results are from Annex Tables 6.A3, 6.A15, 6.A17, and 6.A20. Hobson, K.A. and H.E. Welch, 1992. Determination of trophic relationships within a high Arctic marine food web using delta-13C and delta-15N analysis. Mar. Ecol. Prog. Ser. 84: 9-18. Hargrave, B.T., 1994. Sources and sinks of organochlorines in the Arctic marine food web. In: J.L. Murray and R.G. Shearer (eds). Synopsis of research conducted under the 1993/94 Northern Contaminants Program, pp. 178-184. Indian and Northern Affairs Canada, Ottawa, Environmental Studies 72, 459p. (AAR Figure 6.41) | ||||
|
Cartographer/ Designer |
Graphical production: Philippe Rekacewicz and Emmanuelle Bournay (GRID-Arendal) | ||||
| Appears in |
AMAP Assessment Report: Arctic Pollution Issues |
||||
| Published | 1998 | ||||
| Feedback/Comment/Inquiry | Contact webmaster | ||||
| Search for other graphics |
With related subjects Covering the same geographic area |
||||
|
Available Downloads
(please review use constraints above) |
|
||||
|
Citation/Reference Use constraints |
Please refer to the AMAP policy regarding use and reproduction of AMAP maps and graphics |
