More information and download links below the graphic.
Contaminant emissions, transport and deposition in the Arctic

Click here, or on the graphic, for full resolution.
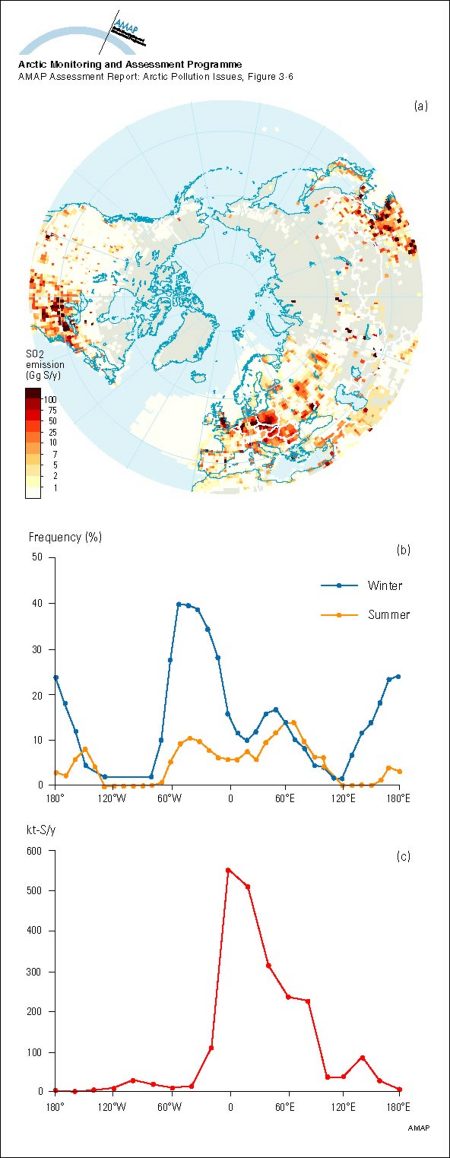
An illustration of the interplay between a) contaminant emissions distribution for sulfur dioxide and b) frequency of atmospheric south-to-north transport, yielding c) a net annual input of sulfur to the Arctic as a function of longitude that favors Euras
| Sources | Title (cont.) that favors Eurasian sources in the winter half of the year. This contaminant has a one-hop pathway in contrast to more volatile persistent organochlorines, PAHs, and mercury. Source(s) '(a) Gridded global emissions inventory of sulfur dioxide for 1985 as compiled on a 1° x 1° grid by the Global Emissions Inventory Activity (GEIA) of the International Global Atmospheric Chemistry Program (IGACP); (b) the frequency of south-to-north transport of air in summer and in winter as a function of longitude from: Iversen, T., 1989a. Some statistical properties of ground level air pollution at Norwegian Arctic stations and their relation to large scale atmospheric flow systems. Atmos. Environ. 23: 2451-2462. (c) the annual input of anthropogenic sulfur to the Arctic at the Arctic Circle as a function of longitude as calculated for July 1978 to June 1979: Barrie, L.A., M.P. Olson and K.K. Oikawa, 1989b. The flux of anthropogenic sulphur into the Arctic from mid-latitudes in 1979/80. Atmos. Environ. 23: 2505-2512.' (AAR Figure 3.6) | ||||
|
Cartographer/ Designer |
Data preparation/GIS: David Henry (GRID-Arendal); Graphical production: Philippe Rekacewicz and Emmanuelle Bournay (GRID-Arendal) | ||||
| Appears in |
AMAP Assessment Report: Arctic Pollution Issues |
||||
| Published | 1998 | ||||
| Feedback/Comment/Inquiry | Contact webmaster | ||||
| Search for other graphics |
With related subjects Covering the same geographic area |
||||
|
Available Downloads
(please review use constraints above) |
|
||||
|
Citation/Reference Use constraints |
Please refer to the AMAP policy regarding use and reproduction of AMAP maps and graphics |
