More information and download links below the graphic.
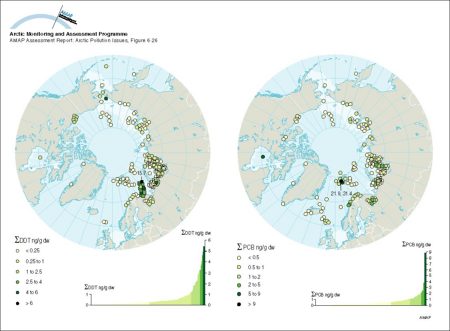
Concentrations of sum-DDT and sum-PCB in marine surface sediments (from grab samples or from top slices of cores) on a circumpolar basis, and the ranked distribution of values

Click here, or on the graphic, for full resolution.
Concentrations of sum-DDT and sum-PCB in marine surface sediments (from grab samples or from top slices of cores) on a circumpolar basis, and the ranked distribution of values
| Sources | Title (cont.) sum-PCB represents the sum of 13 to 60 congeners, but all studies determined a common suite of 10 to 12 (CBs 18, 28, 52, 66/95, 101, 105, 110, 118, 138, 153/132, 170, 180). Sum-DDT = sum of p,p’-DDE, -DDT, -DDD, and o,p’-DDT. Full data set is in Annex Table 6.A14. (AAR Figure 6.26) | ||||
|
Cartographer/ Designer |
Data preparation/GIS: Simon Wilson (AMAP), David Henry (GRID-Arendal); Graphical production: Philippe Rekacewicz and Emmanuelle Bournay (GRID-Arendal) | ||||
| Appears in |
AMAP Assessment Report: Arctic Pollution Issues |
||||
| Published | 1998 | ||||
| Feedback/Comment/Inquiry | Contact webmaster | ||||
| Search for other graphics |
With related subjects Covering the same geographic area |
||||
|
Available Downloads
(please review use constraints above) |
|
||||
|
Citation/Reference Use constraints |
Please refer to the AMAP policy regarding use and reproduction of AMAP maps and graphics |
