More information and download links below the graphic.
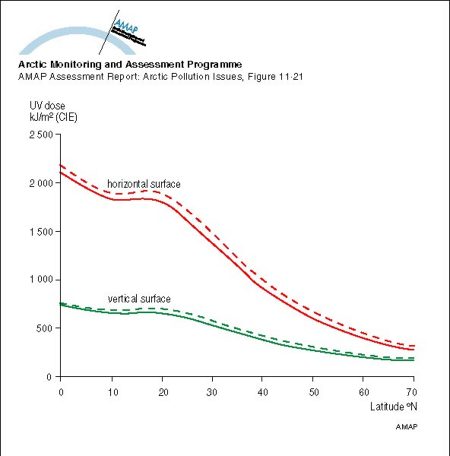
Average annual UV dose falling on vertical and horizontal surfaces as a function of latitude The solid lines represent the situation for the normal UV level with undisturbed ozone (prior to 1978)

Click here, or on the graphic, for full resolution.
Average annual UV dose falling on vertical and horizontal surfaces as a function of latitude The solid lines represent the situation for the normal UV level with undisturbed ozone (prior to 1978)
| Sources | Title (cont.) The dashed lines are for the UV level following the maximum estimated global ozone depletion (in the year 2000). (AAR Figure 11.21) | ||||
|
Cartographer/ Designer |
Graphical production: Philippe Rekacewicz and Emmanuelle Bournay (GRID-Arendal) | ||||
| Appears in |
AMAP Assessment Report: Arctic Pollution Issues |
||||
| Published | 1998 | ||||
| Feedback/Comment/Inquiry | Contact webmaster | ||||
| Search for other graphics |
With related subjects Covering the same geographic area |
||||
|
Available Downloads
(please review use constraints above) |
|
||||
|
Citation/Reference Use constraints |
Please refer to the AMAP policy regarding use and reproduction of AMAP maps and graphics |
