More information and download links below the graphic.
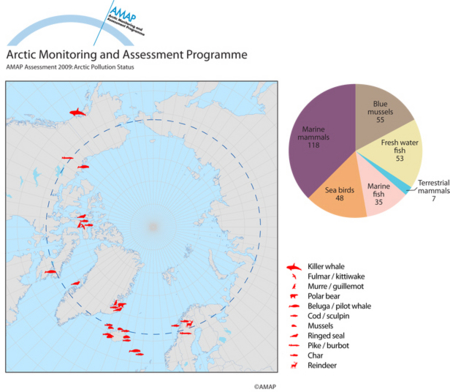
Available time-series of legacy POPs in Arctic biota

Click here, or on the graphic, for full resolution.
Available time-series of legacy POPs in Arctic biota. These time-series generally show decreasing trends over the past two- to three-decades
| Sources | AMAP | ||||||
|
Cartographer/ Designer |
John Bellamy | ||||||
| Appears in |
AMAP Assessment 2009: Arctic Pollution Status |
||||||
| Published | 2010 | ||||||
| Feedback/Comment/Inquiry | Contact webmaster | ||||||
| Search for other graphics |
With related subjects Covering the same geographic area |
||||||
|
Available Downloads
(please review use constraints above) |
|
||||||
|
Citation/Reference Use constraints |
Please refer to the AMAP policy regarding use and reproduction of AMAP maps and graphics |
