3. Flood benefits
3.4 The composition of flood losses
It is standard practice to breakdown total flood damage into that occurring within the various economic sectors, usually domestic, commercial and agricultural:
- The domestic category includes private housing and small commercial businesses carried out from home such as family shops.
- Commercial/services covers industrial premises, schools, hospitals, roads, bridges and services such as power and telecommunications facilities.
- Agriculture covers crops, livestock, aquaculture losses and damage to irrigation infrastructure.
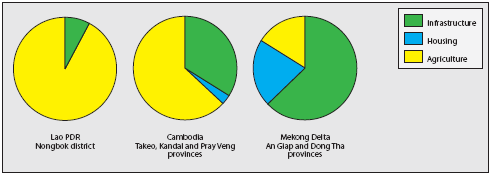
Although based on local but detailed surveys, the results available in Haskoning (2008) clearly indicate that there are significant regional distinctions in the composition of overall damage which reflect differences in population density, the degree of urbanisation and the structure of local socioeconomics(Figure 3.14).
Figure 3.14: Proportion
(%) of total flood damage by sector during 2000.
Source: local survey data given in Haskoning (2008).
- In the Mekong Delta in Viet Nam the picture changes completely. Here the population density is extremely high with a large proportion living in urban centres at risk from regular flood inundation. Commercial and service infrastructure losses (62%) predominate with agricultural damage falling to just 16% of the total. One major contributory factor is that the secondary commercial and industrial losses, that is the financial costs due to the suspension of economic activity and reduced levels of service provision, are high and continue for a considerable period after the floodwaters recede. Another factor that contributes to the lower relative agricultural losses is that drought and salinity are now considered to be a greater threat to rice yields and production than floods in the delta due to the adoption of hybrids that can withstand longer periods of submergence (Buu and Thi Lang, 2003).
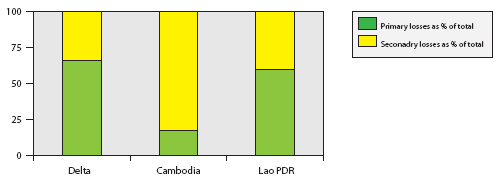
A survey of businesses in the same sample districts sought to estimate the relative levels primary and secondary losses, the results for which are shown in Figure 3.15. The higher to replace it and repair any structural secondary losses in Cambodia possibly reflect the fact that stock and inventory values are lower than in Viet Nam and once stock is lost the ability to replace it takes much longer given greater financial constraints. Consequently ongoing secondary damage accumulates over a longer period of time and therefore comprises a higher proportion of the total loss.
Figure 3.15: Primary and
secondary flood losses as a proportion of total damage for
business
enterprises. Source: district survey data available in Haskoning
(2008).
Choose a newsletter:

