Your query returned 99 graphics.
Results 91 - 99
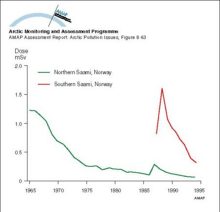
Dose estimates based on wholebody measurements (see Figure 836) for two groups (northern Saami and southern Saami) of Norwegian reindeer-breeding SaamiDose estimates based on wholebody measurements (see Figure 836) for two groups (northern Saami and southern Saami) of Norwegian reindeer-breeding Saami |
|
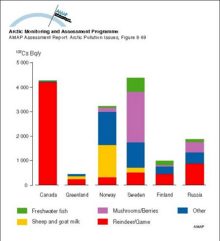
The relative contribution to the 137Cs content of the diet of the ‘average’ population of various Arctic areas for the period 1990 to 1994The relative contribution to the 137Cs content of the diet of the ‘average’ population of various Arctic areas for the period 1990 to 1994 |
|
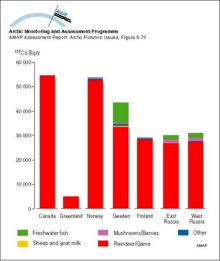
The relative contribution to the 137Cs content of the diet of the ‘selected’ population of various Arctic areas for the period 1990 to 1994The relative contribution to the 137Cs content of the diet of the ‘selected’ population of various Arctic areas for the period 1990 to 1994 |
|
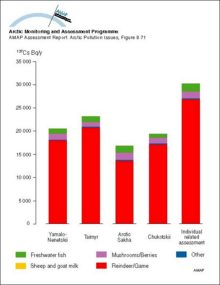
Estimated source of dietary intake of 137Cs by various indigenous population groups in different regions of Arctic Russia in 1993, and the AMAP region as a wholeEstimated source of dietary intake of 137Cs by various indigenous population groups in different regions of Arctic Russia in 1993, and the AMAP region as a whole |
|
Distribution (in percentiles) of whole blood selenium concentrations in East and North Greenland and in Greenlanders living in DenmarkDistribution (in percentiles) of whole blood selenium concentrations in East and North Greenland and in Greenlanders living in Denmark |
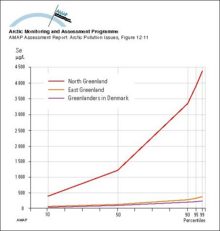
|
Geometric mean levels of HCB, DDE and PCBs in cord blood of newborns in different Canadian population groupsGeometric mean levels of HCB, DDE and PCBs in cord blood of newborns in different Canadian population groups |
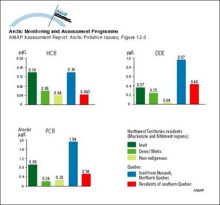
|
Concentrations of PCB congeners in cord plasma from Nunavik and southern Quebec newbornsConcentrations of PCB congeners in cord plasma from Nunavik and southern Quebec newborns |
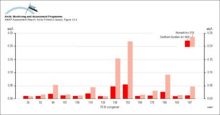
|
Body burdens of radiocaesium (yearly averages) across the Canadian ArcticBody burdens of radiocaesium (yearly averages) across the Canadian Arctic |
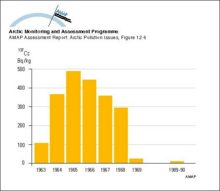
|
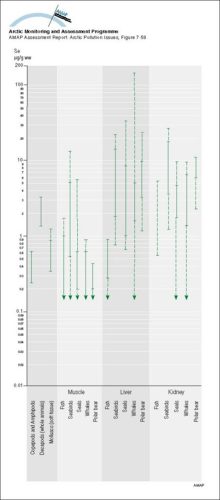
Summary of ranges of Se levels (mean values) in Arctic marine organisms Solid parts of the lines indicate ranges for Greenlandic dataSummary of ranges of Se levels (mean values) in Arctic marine organisms Solid parts of the lines indicate ranges for Greenlandic data |
|

water OR waste searches for either of these words
oceans AND biodiversity searches for blocks with both words
pollution NEAR water searches for blocks with either of these words, with them being closer ranks higher
"climate change" searches for this phrase