Previous    Next 

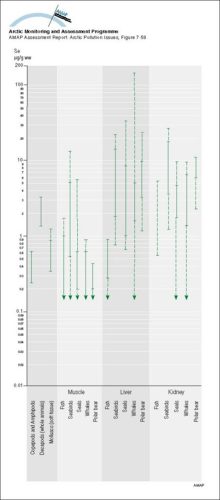
Summary of ranges of Se levels (mean values) in Arctic marine organisms Solid parts of the lines indicate ranges for Greenlandic data

Summary of ranges of Se levels (mean values) in Arctic marine organisms Solid parts of the lines indicate ranges for Greenlandic data

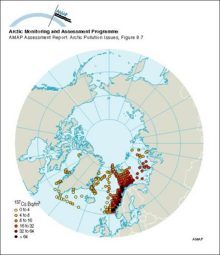
Cs-137 activity concentrations in surface seawater in 1979 and 1982

Cs-137 activity concentrations in surface seawater in 1979 and 1982

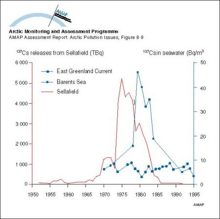
Seawater concentrations of 137Cs in the Barents and East Greenland Seas compared to the yearly releases from Sellafield

Seawater concentrations of 137Cs in the Barents and East Greenland Seas compared to the yearly releases from Sellafield

Average 137Cs activity concentrations in surface sediments of some Arctic seas sampled from 1992 to 1995

Average 137Cs activity concentrations in surface sediments of some Arctic seas sampled from 1992 to 1995

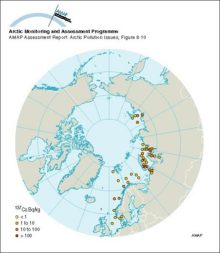
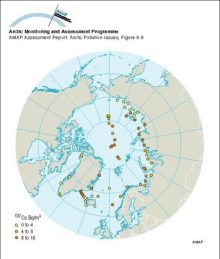
Cs-137 activity concentrations in surface seawater in 1994

Cs-137 activity concentrations in surface seawater in 1994

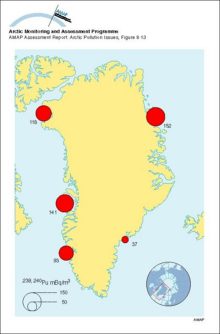
Concentrations of 239,240Pu in seawater around Greenland, 1968

Concentrations of 239,240Pu in seawater around Greenland, 1968

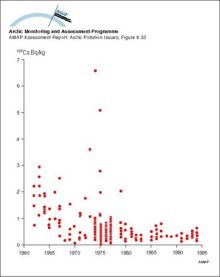
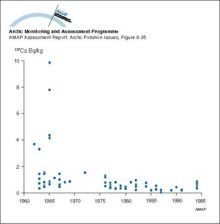
Changes with time in 137Cs activity concentration in marine fish from Greenland waters

Changes with time in 137Cs activity concentration in marine fish from Greenland waters

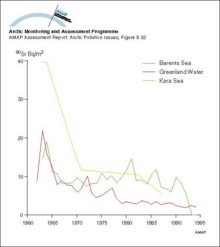
Changes with time in 90Sr activity concentrations in surface seawater from Greenland waters and the Barents and Kara Seas

Changes with time in 90Sr activity concentrations in surface seawater from Greenland waters and the Barents and Kara Seas

Changes with time in 137Cs activity concentration in whales from Greenland waters

Changes with time in 137Cs activity concentration in whales from Greenland waters

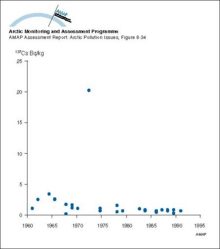
Changes with time in 137Cs activity concentration in seals from Greenland waters

Changes with time in 137Cs activity concentration in seals from Greenland waters

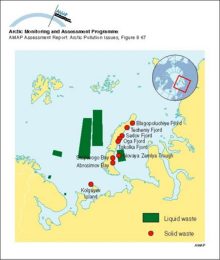
Locations of sea dumping of radioactive waste in the Russian Arctic

Locations of sea dumping of radioactive waste in the Russian Arctic

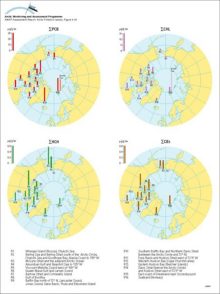
Organochlorine levels in polar bear adipose tissues (µg/g lw), adjusted to levels expected in 11-year-old males (after correction for age and sex), for sum-PCB, sum-CHL, sum-HCH, and sum-CBz, and in Arctic fox from Svalbard for sum-PCB and sum-CHL

Organochlorine levels in polar bear adipose tissues (µg/g lw), adjusted to levels expected in 11-year-old males (after correction for age and sex), for sum-PCB, sum-CHL, sum-HCH, and sum-CBz, and in [..]
Organochlorine levels in polar bear adipose tissues (µg/g lw), adjusted to levels expected in 11-year-old males (after correction for age and sex), for sum-PCB, sum-CHL, sum-HCH, and sum-CBz, and in Arctic fox from Svalbard for sum-PCB and sum-CHL

Tracer concentration on a vertical section (along Y=0 on Figure 346) after 15 years; a) no neptune, centered difference; b) neptune, flux-corrected transport; c,d) velocity normal to the section with positive "into" the page, negative "out" of the page;

Tracer concentration on a vertical section (along Y=0 on Figure 346) after 15 years; a) no neptune, centered difference; b) neptune, flux-corrected transport; c,d) velocity normal to the section with [..]
Tracer concentration on a vertical section (along Y=0 on Figure 346) after 15 years; a) no neptune, centered difference; b) neptune, flux-corrected transport; c,d) velocity normal to the section with positive "into" the page, negative "out" of the page;
  Previous    Next 


To refine your search you can combine your search strings with AND, OR, NOT and NEAR and phrases can be quoted:
water OR waste searches for either of these words
oceans AND biodiversity searches for blocks with both words
pollution NEAR water searches for blocks with either of these words, with them being closer ranks higher
"climate change" searches for this phrase